
GRADIENT DESCENT (COST FUNCTION)
THE ONE THAT TELLS THE MODEL HOW IT’S PERFORMING.

THE ONE THAT TELLS THE MODEL HOW IT’S PERFORMING.
In my previous story about Gradient descent, I laid the foundation of what the Gradient descent algorithm does in the neural network. In this story, we are going to dive deep into the math behind the gradient descent algorithm and how it helps us find the best result in an efficient way.
This story is based on what I learned about Gradient descent from various sources like YouTube, Online courses and some Blogs. To better understand this, I highly recommend you read my previous story or any other sources you find about Gradient Descent.
We all know how a Neural Network works and how powerful they are, and this gradient descent is one of the algorithms that helps in learning the complex inputs that we give to the model. Some people are scared because Gradient Descent works based on calculus and Linear algebra. A little bit of both of them is used. But for this story, you don’t have to be a master in it, nor am I. My goal is to make you understand the way it works, like starting a small fire, and your job is to make it burn higher by your thinking.
WHAT YOU ARE GOING TO LEARN:
MATH BEHIND GRADIENT DESCENT.
WHAT IS MEANT BY COST FUNCTION?
WHAT IS MEAN SQUARED ERROR AND HOW IS IT CALCULATED?
Before we are going to start learning about the gradient descent. I want to share something with you that is useful for studying, but also in life.

If you can’t understand this story or anything you learn in life, that doesn’t mean you aren’t learning or you can’t learn. In fact that is the first step towards real learning.
OKAY, LET’S GET STARTED.
We know that Machine Learning consists of a lot of math, this is because machines can only understand numbers, am I right? And I want you to take it this way about the way machine learning works.
It will convert the input of any format into numbers we will take this as number1, and the Model itself will have certain numbers we will take this as number2, and the model will perform arithmetic operations between this two numbers and the result will be a new number which will be converted into any format and send as a output. HEY, IF YOU CAN’T UNDERSTAND, A PICTURE WILL BE USEFUL.
, and produces an output number. Annotations mention input/output can be various data types like audio or video.")
If the output is not the correct one or not the one we expected. Then we should make the machine give us a correct output. For this there some changes should happen, right? From the above diagram, can you tell me what can be changed in Machine Learning?. Ans for this in the comment.
We can see that the only change can be the Numbers the model has this in ML is called Parameters. Of course, the input can be changed, but from the Model’s learning point of view, only the parameters get changed.
Let’s Learn this with an example so that the learning can be fruitful.

You can see that in the diagram, there is a line which is called the best fit line because it correctly predicts the points in the graph or you can say that the distance between the points and the line is very low. Initially this isn’t the case.
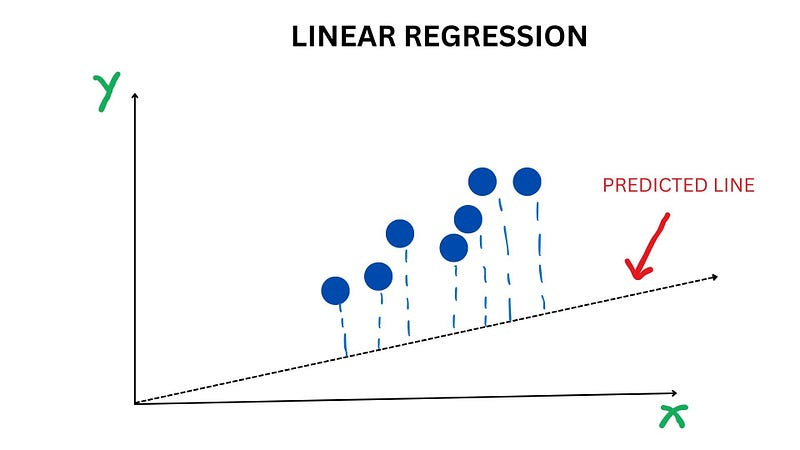
In here, we can see that the model predicted a line that does not pass through the points, and I marked a line from the points to the line so that you can understand that the predicted line is nothing but points, and the model predicted that the 7 seven points are in that predicted line.
From seeing the picture, we can say that the predicted line is wrong and this is called the worst fit line, but how the machine understands that the line it predicted is wrong and it needs to change it by calculating the cost function.
COST FUNCTION:
This function is used in Neural Network to find the error or to measure how much worse the model is performing using various calculating methods, and based on the model, the cost function also varies.
In a nutshell it provides feedback of how wrong the model is then the model will update itself based on the feedback

The model will find its mistake through the feedback of a cost function, and the cost function that is used in Linear regression is Mean squared error.
MEAN SQUARED ERROR:
This will calculate the error of the model by finding the distance between each datapoint's actual value and the predicted value of the model then square them up .This is done for each data point and Then add all of them and divide it by the total no of observations or datapoints.
I think the calculation of the Mean squared error for the above graph can be helpful for you to understand.

In the above image, you can see that I calculated the Mean Squared Error for the worst-fit line.
Wait a minute. If it is a line, then it means it's formed by an equation, right?
The equation for the worst-fit line is y = 4x + 3, and the equation for the best-fit line is y = 5x+7.

Now what I am going to say is very important, so all attention in here. In the above image, you can see that the linear equation for both the lines and the difference between them is the Weight. “When the weight changes, the Line changes”. If you observe for both lines, the cost function is different, and if you keenly observe, the cost function is less for the line that is the best fit Then we can say that “When the weight changes, the Line changes. If the Line changes, then the Cost function also gets changed”.
TAKE A MOMENT AND THINK THROUGH IT.
Then this shows that for any particular equation(any model), the weight I choose is going to affect the performance of the model which resulting in various cost function values.
Let’s illustrate this using a Graph

Like the image, we can plot various cost function values for different weights, but only a few of them are going to give me a cost function value that is going to be less.
Imagine trying to get a weight that gives us a very low-cost function. In the above scenario, we can see that the 5 is the weight that gives us a low cost function value. But before hand, we don’t know that we will try weights with various numbers and find the cost function value for it. As you can imagine, this is a very tedious task. We want our model to find the best weight that provides the best fit line, which means the cost function is low, and this is where the gradient descent comes into play.
WHOA WE COVERED A LOT OF THINGS AND YOU KNOW WHAT I AM HAPPY ABOUT IT. IN EACH STORY, WE ARE MOVING TOWARDS THE BETTER UNDERSTANDING OF GRADIENT DESCENT.
To be honest I learned a lot while writing this story, I belive you also found value in this story.
WHAT YOU LEARNED:
COST FUNCTION DEFINITION.
MEAN SQUARED ERROR, HOW IT IS CALCULATED.
HOW WEIGHT AFFECTS THE COST FUNCTION.
In the next story, I will give an in-depth explanation about how gradient descent helps us in finding the weight that gives us the best fit line in a very optimal way.
YOUR FEEDBACK ABOUT THIS STORY IS HEARTILY WELCOMED
THANK YOU FOR SPENDING YOUR TIME WITH ME…….